Overview
1. About the IVE
The Immersive Video Environment (IVE) is a web-based system to quickly create and interact with panoramic video footage that can be overlayed with additional content (images, web pages, videos). The underlying system also allows for flexible integration of existing systems (e.g. dynamic signage systems) and different means of interaction (e.g. speech, pointing gestures, remote control via mobile devices).
The IVE can be used to make people feel as if they are in a remote location while they are actually standing inside a lab with three large screens that are showing the augmented video footage. Use cases for the IVE include running experiments and user studies, joint (participatory) design exercises and educational scenarios. This document is a tutorial that explains how to create content for the IVE.
If you want to see some functionalities of the system immediately, just watch the following video:
1.1. IPED-Toolkit
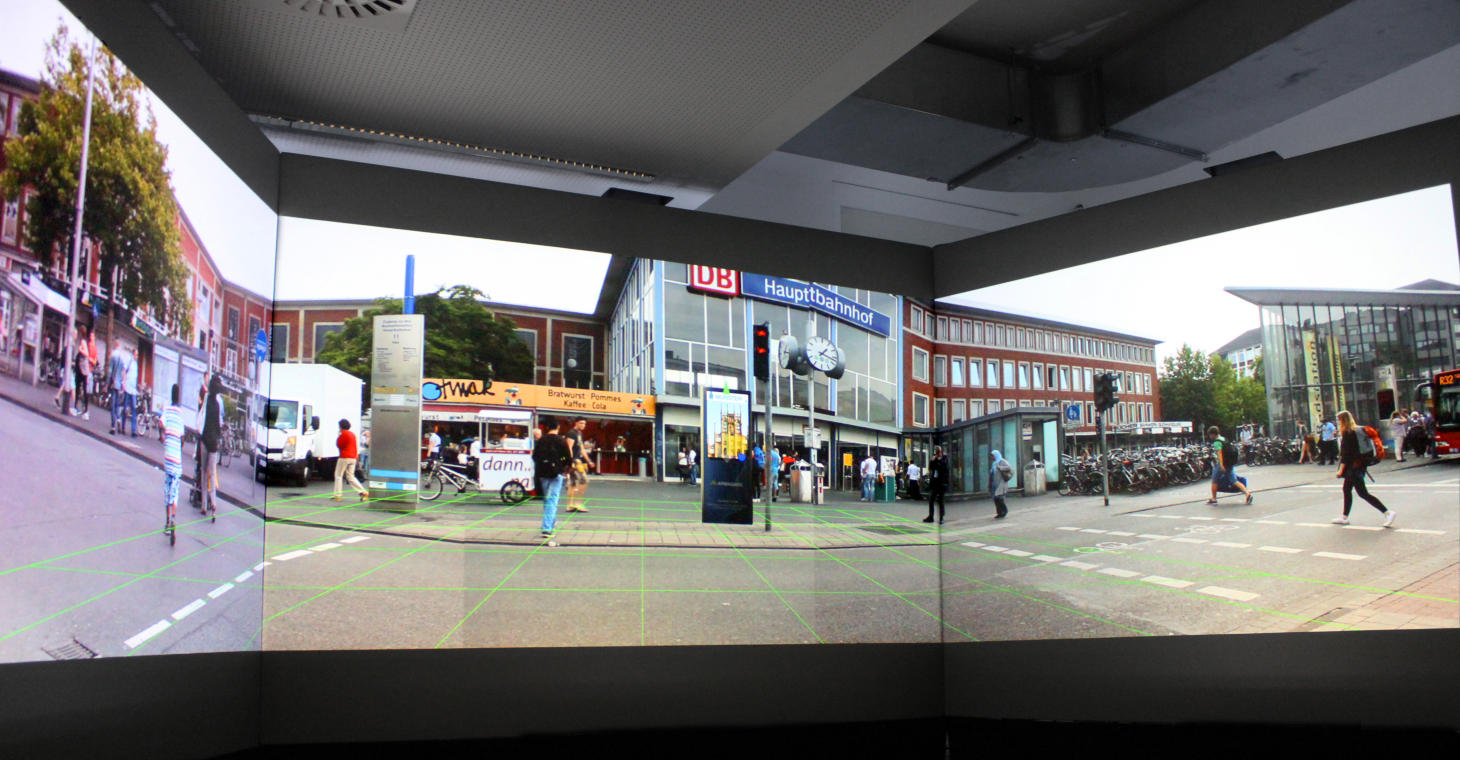
The Immersive Video Environment (IVE) is the next version of the previous developed Public Display Evaluation and Design Toolkit (IPED-Toolkit), which was designed by Ostkamp and Kray [1]. The idea behind the IPED-Toolkit was to use the system for quick prototyping and evaluating of public display systems. Instead of doing it in reality, which might be very expensive, the IPED-Toolkit can be used to easily test public displays in a virtual reality. To provide a virtual reality, the IPED-Toolkit used an immersive video environment - also called CAVE system - in which a user stands in the middle of three screens as in the picture below. The screens are spatially arranged, so that the user sees the video footages in a panoramic view and feels as he would be part of the scene. This is the reason why such a system is also named immersive. During the implementation of the IPED-Toolkit, it was found out, that the system is also capable of other things, not only limited to public displays. To build a more open toolkit for research and to solve some shortcomings, the 2nd version was introduced and renamed to IVE. It is still in development and does currently not cover all features of the IPED-Toolkit. Please checkout the roadmap for more information about it.
1.1.1 original IPED paper
Public displays have become ubiquitous in urban areas. They can efficiently deliver information to many people and increasingly also provide means for interaction. Designing, developing, and testing such systems can be challenging, particularly if a system consists of many displays in multiple locations. Deployment is costly and contextual factors such as placement within and interaction with the environment can have a major impact on the success of such systems. In the course of our research we developed a new prototyping and evaluation method for public display systems that integrates augmented panoramic imagery and a light-weight, graph-based model to simulate such systems. Our approach facilitates low-effort, rapid design of interactive public display systems and their evaluation. We realized a prototypical implementation and carried out an initial assessment based on a comparison with existing methods, our own experiences, and an example case study.
2. Technical overview
2.1. Components
The IVE can be divided into 4 parts:
- the CREATOR, which is the part to create and edit the data
- the VIEWER, which is the part of the system the user sees, when he stands inside the CAVE system
- the REMOTE CONTROL, which is the part the user or an experimenter can use to control the IVE during a study
- the SERVER, which hosts all 3 previous components and builds the core of the system.
2.1.1. Creator
The Creator provides a graphical user interface to manage the data. You can create, edit and delete Scenarios, Locations, Videos, and Relationships. Checkout the section about data to see how the graph has been designed and import how you can create and added own data.
2.1.2. Viewer
The Viewer is the application, which runs on the IVE computer with the 3 attached screens/projectors (the CAVE system). The panoramic video footages are displayed based on the current selected location. If there are overlays attached to the current displayed video, it will be rendered inside the browser.
2.1.3. Remote control
The Remote control is an application, which runs on a smartphone and give the user or a scientist the possibility to interact with the IVE, for example:
- to change the current Scenario
- to change the current Location, if there exists at least one connected Location
- to change the current Video, if there are multiple Videos
- to show or hide
2.1.4. Server
The Server builds the core of the whole system. All 3 clients are hosted on a Nodejs webserver. A REST-API connects all 3 clients with a graph-database (Neo4j), in which all data has been stored. A built-in websocket-server allows the communication between the VIEWER and the REMOTE CONTROL. If there are other clients, like sensors, there are 2 ways to communicate with the system. It is possible to communicate over websockets. If the device doesn’t support websockets, it can send HTTP-request to the REST-API, in which some handlers forwards the message over websockets to the VIEWER and the Remote control. For a better overview, please checkout the image of the architecture below.
2.2. Architecture

Under the hood, the following technologies are used:
| Technology | Description |
|---|---|
| Nodejs | Webserver to allow hosting static files (e.g. panoramic video footages), but also the three SPAs, furthermore it provides a REST-API, which handles request and query data from the database |
| Socket.io | Websocket-server, which allows bidirectional communication between two or more clients to enable real-time interactions |
| Neo4j | Graph-database, which allows the construction of graph, where each node represents a location on which a panoramic footage has been recorded |
| Angularjs | Frontend Framework to build Single-Page-Applictions (SPAs) |
| Three.js | 3D library for Javascript, which allows rendering virtual objects on top of the panoramic footages |
For a more details about the required dependencies, checkout the package.json and bower.json files inside the repository.